It sounds simple enough, but monitoring today’s massive networks can be hopelessly complex.
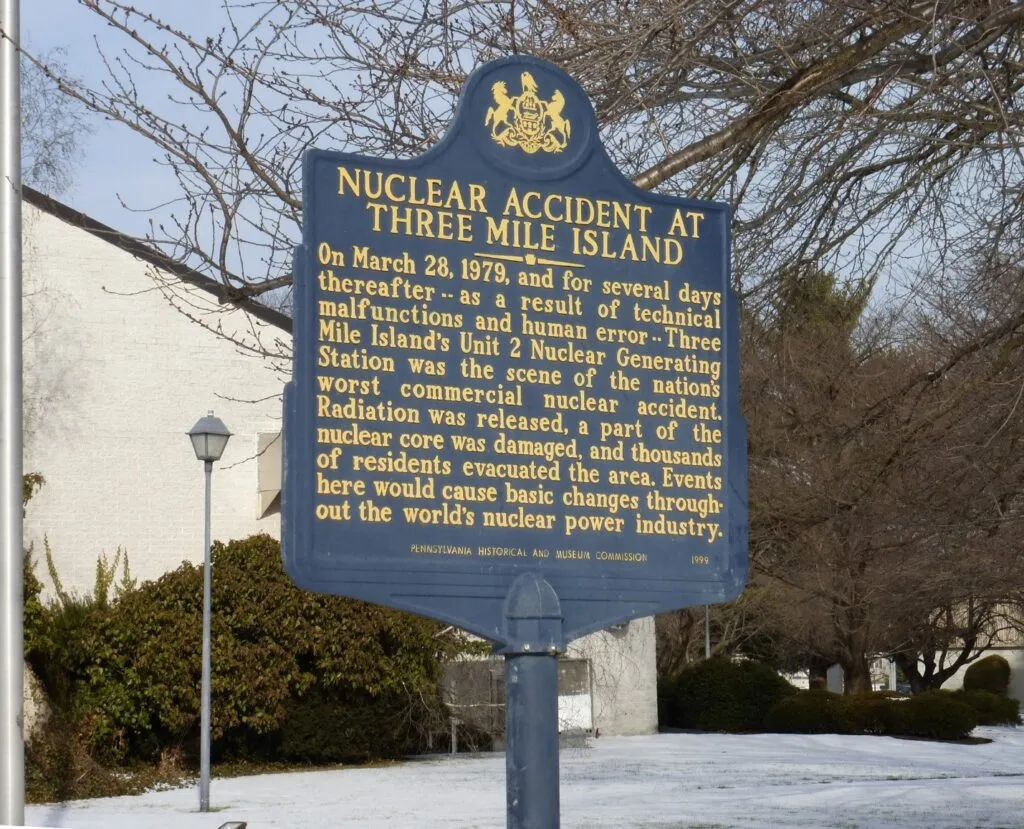
In 1979, at the Three Mile Island nuclear power plant, a stuck valve drained coolant from nuclear fuel rods, causing the rods to heat uncontrollably. Within seconds, there were hundreds of alerts, hopelessly confusing the operators.
In the end, one engineer ignored all the alerts and simply turned on a water pump. The crisis was averted, but only after radioactive steam was released into the community. The moral of this story is that the complexity of the system has rendered traditional monitoring systems unusable.

We all know about “economies of scale.” It is why Amazon beat local bookstores, and we get our electricity from utilities instead of generating it ourselves. However, not all processes benefit from scale.
Take hierarchical management in business, which becomes less effective at scale. Decision-making is slower and executives make worse decisions because they simply cannot be as knowledgeable about specific matters as leaders at smaller, more focused firms.
It turns out that scale can drive both economies and diseconomies, and believe it or not, that is the perfect place to start today’s blog post on how Graphiant made it simple to monitor a massive global network.
Here is how network monitoring works today.
It sounds simple enough, but monitoring today’s massive networks can be hopelessly complex.
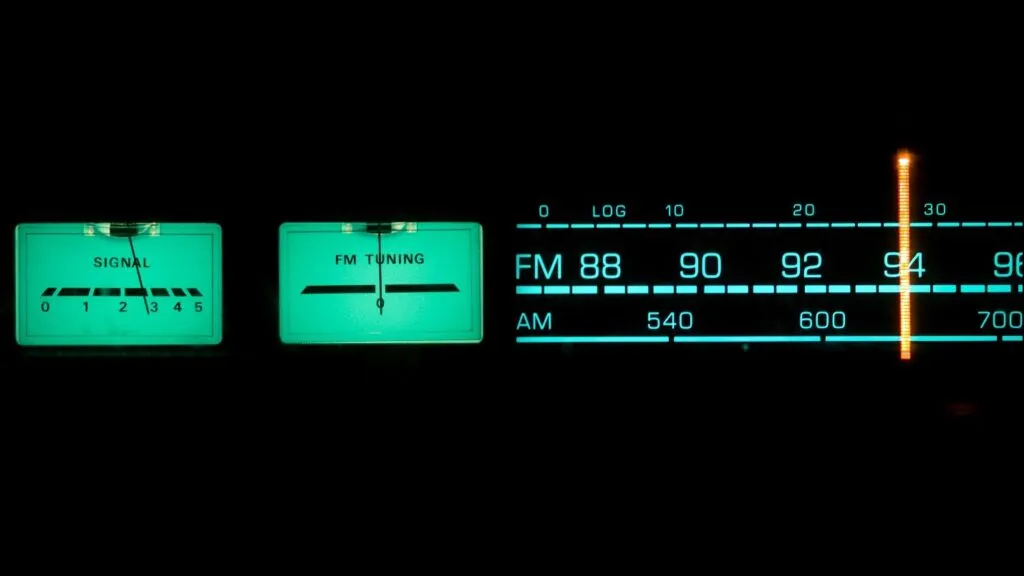
For instance, you cannot monitor everything, so you resort to ‘sampling’, where you monitor every Nth metric. This leads to missed issues and loss of context.
Secondly, the “network effect” increases exponentially as new nodes are brought online.

These lessons resonate with us at Graphiant, where we run a massive and complex global network. This led to important changes in how we manage our global footprint:
“Data is not information, information is not knowledge, knowledge is not understanding, understanding is not wisdom.”
-Clifford Stoll and Gary Schubert
At Three Mile Island, the operators were flooded with data. What they needed was the knowledge of what was wrong, and the wisdom to know how they could fix it.
By contextualizing the metric streams and applying hierarchical rule-based logic written by domain experts, we have reduced the background noise that the operator faces daily.
The changes we made worked! Most days, operators get real-time notifications of clearly described problems (not just raw data), and we continue to train the software to auto-remediate the problem. As a result, the operator only sees a record of the fix.
Recently, Azure had an unplanned outage that knocked out one of our Controllers. Within 60 seconds, our operators were notified about the Controllers. They spun new Controllers up within minutes – problem solved. The collapse of the Controller did not result in thousands of alerts coming in from the clients that were connected to the Controller. Operators received one consolidated alert pointing to the issue with surgical precision.
Best Practices for Wisdom-Based Monitoring
We’ve established best practices for using this new approach:
In the end, replacing data with knowledge and wisdom has driven two key benefits for us. First, we encounter far fewer negative events (downtime, brownouts, etc.). Moreover, we respond to events more promptly.
Better yet – we manage our network with fewer operators
The lesson here? Sometimes, scale is your friend. However, when it is not, you must devise a method to manage the scale effectively.
Follow Vinay on LinkedIn.
View his demo on Graphiant’s Observability Features on YouTube.